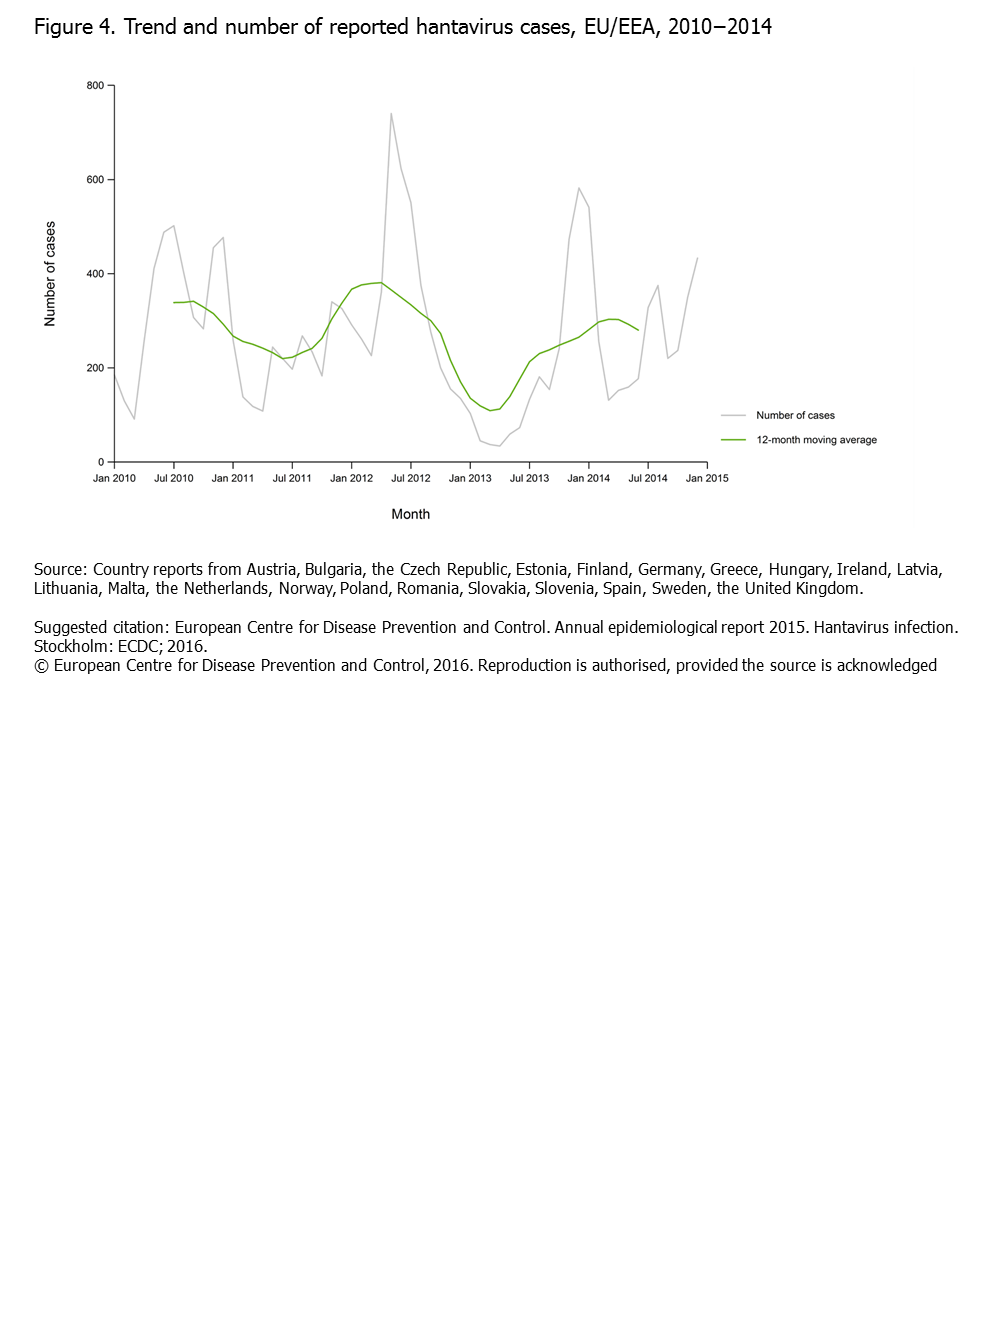
Figure 4: Trend and number of reported hantavirus infection cases, EU/EEA, 2010−2014
Trend and number of reported hantavirus infection cases, EU/EEA, 2010−2014
Download

fig4.PNG - EN - [PNG-94.92 KB]
Trend and number of reported hantavirus infection cases, EU/EEA, 2010−2014