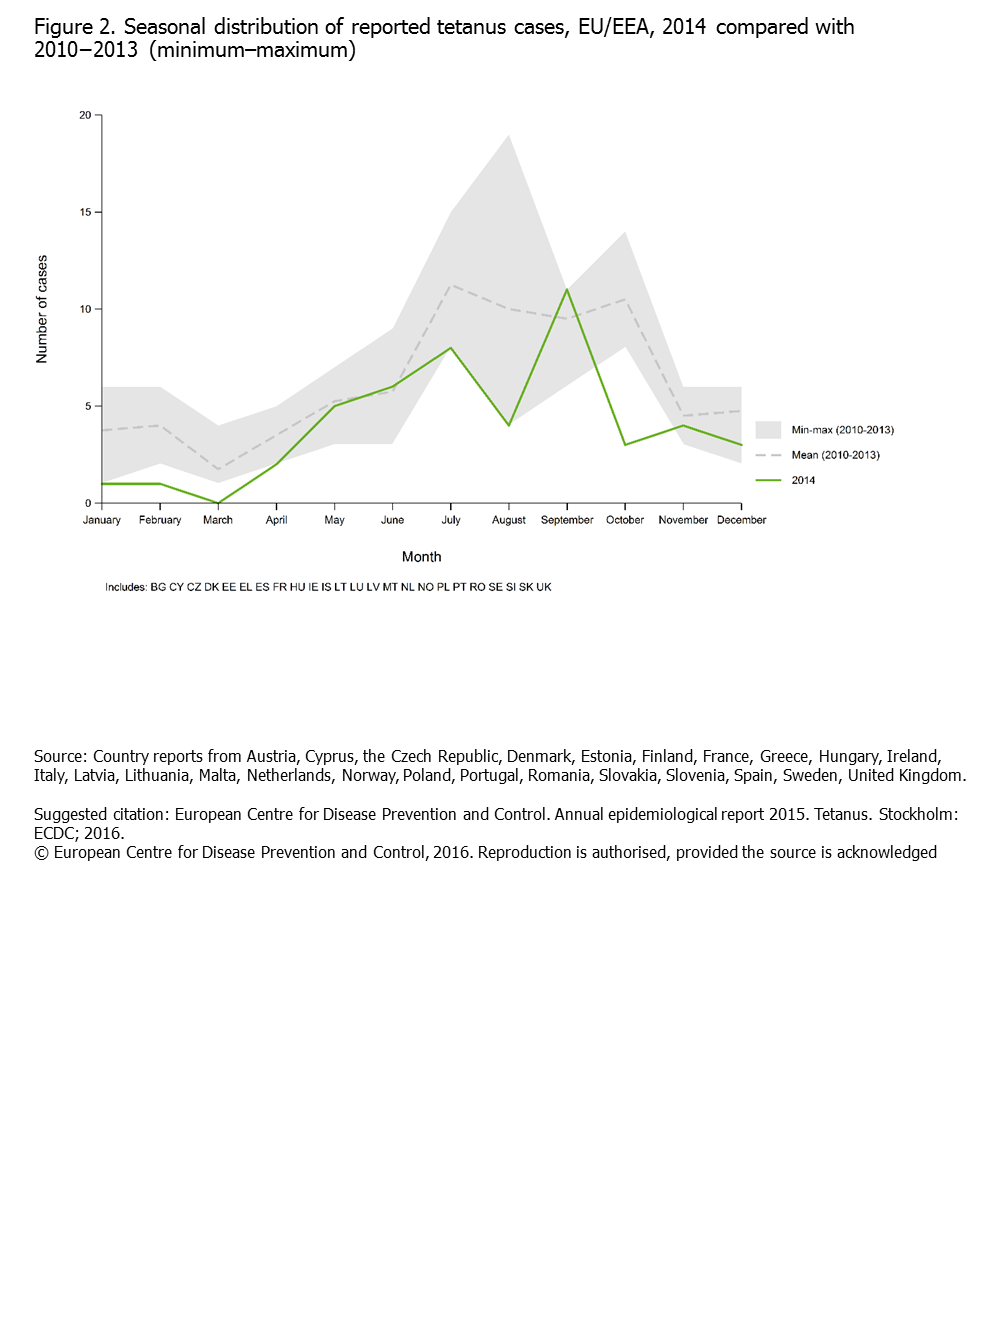
Figure 2. Seasonal distribution of reported, locally acquired Tetanus cases, EU/EEA, 2014 compared with 2010−2013
Seasonal distribution of reported, locally acquired Tetanus cases, EU/EEA, 2014 compared with 2010−2013
Download

fig2.PNG - EN - [PNG-113.12 KB]