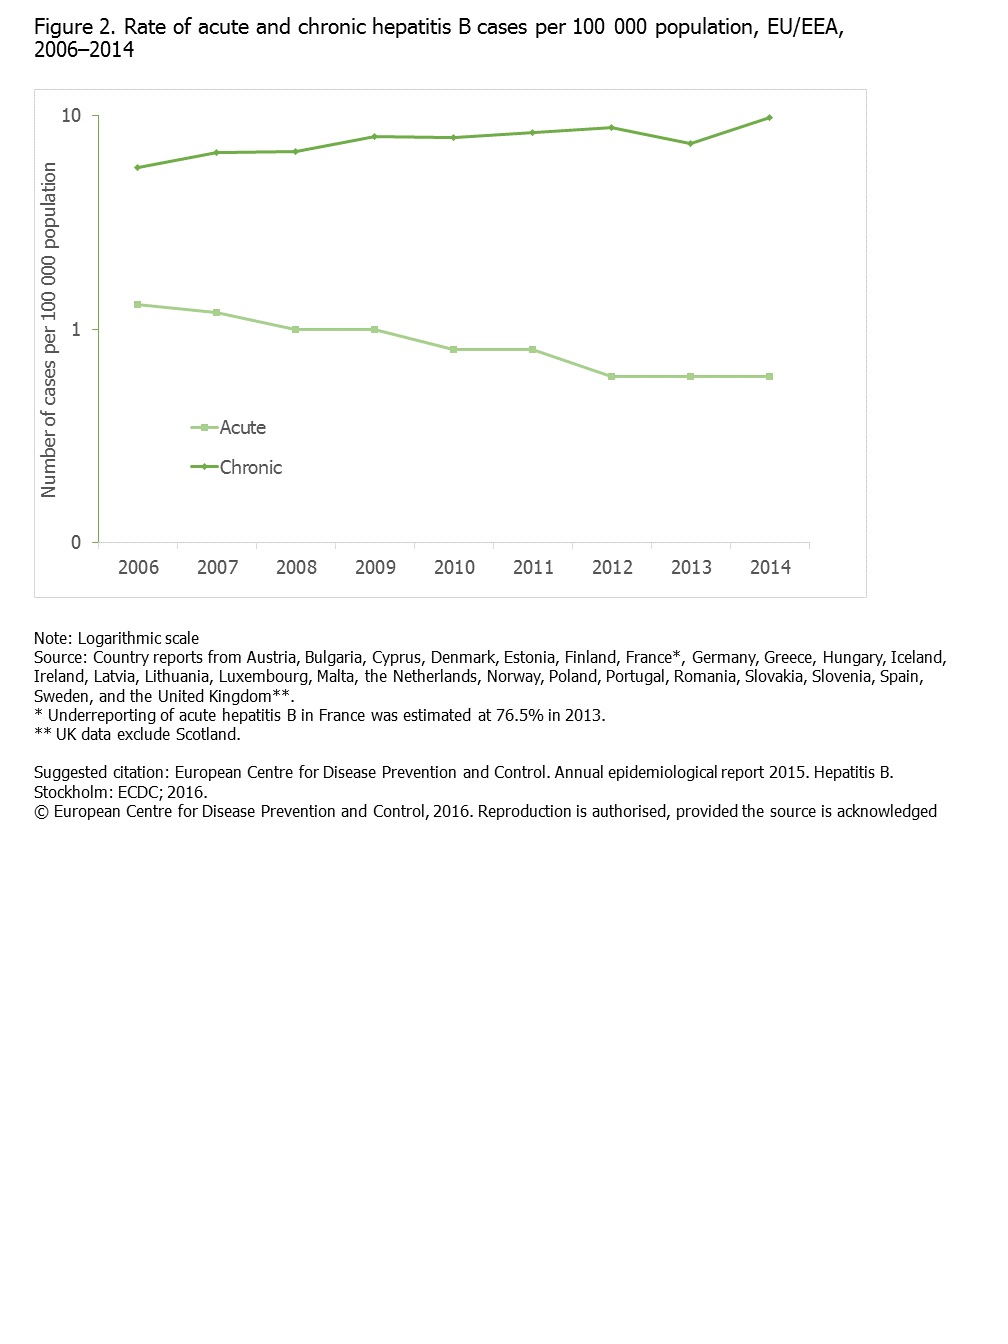
Figure 2. Rate of acute and chronic hepatitis B cases per 100 000 population, EU/EEA, 2006–2014
Rate of acute and chronic hepatitis B cases per 100 000 population, EU/EEA, 2006–2014
Download

Slide4.PNG - EN - [PNG-36.46 KB]
Rate of acute and chronic hepatitis B cases per 100 000 population, EU/EEA, 2006–2014