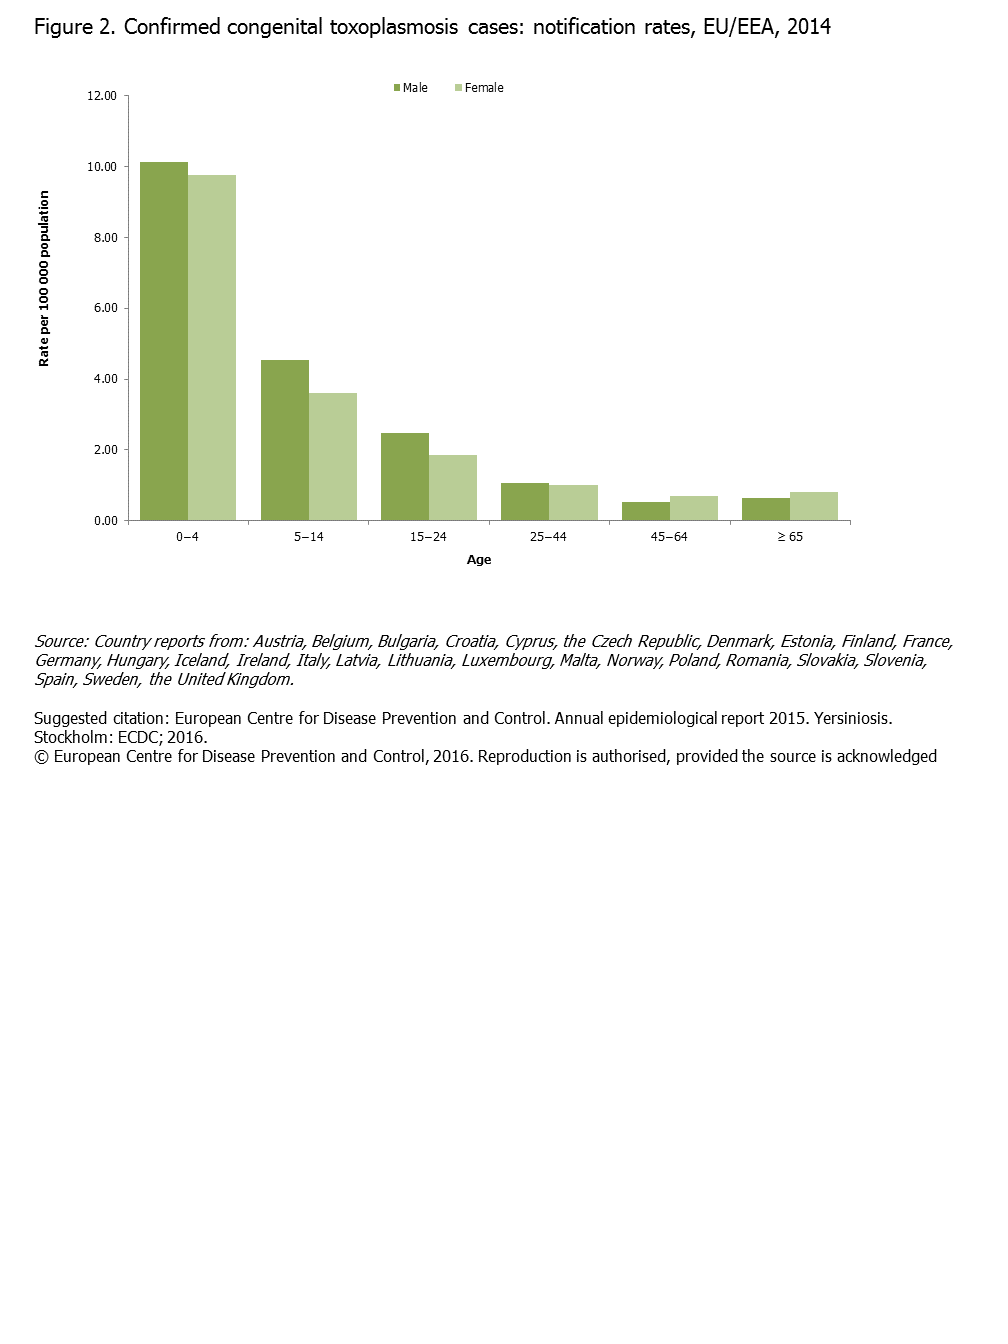
Figure 2. Confirmed yersiniosis cases: rates by age group and gender, EU/EEA, 2014
Confirmed yersiniosis cases: rates by age group and gender, EU/EEA, 2014
Download

Slide2.PNG - EN - [PNG-29.6 KB]
Confirmed yersiniosis cases: rates by age group and gender, EU/EEA, 2014